
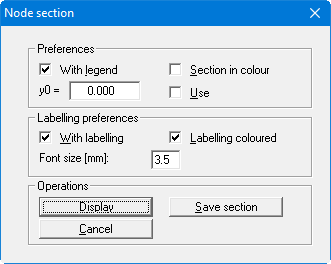
After confirming the section course the following dialog box opens in all cases:
-
"Preferences" group box
Specify whether a legend containing the selected data is to be subsequently displayed. This legend allows assignment of the measured data to the line colours used. If the "Section in colour" check box is activated the whole area of the data is filled. The colours defined for the measured data in the menu item "Edit/Value colours" are used .
The sequence of the selected data is important if complete colour fill is employed. Visualisation follows in the sequence specified during input using "Edit/Value names". In order to move a value, which would otherwise be hidden behind other data, forwards in the section visualisation, copy the value using the menu item "Edit/Modify values" to the end of the data.
It is also possible to specify a zero value for the y-axis ("y0"), defining the intersection of the x-axis with the y-axis. In this case the "Use" check box must be activated. If this option is not used, the x-axis will intercept the y-axis at the smallest value of y. For example, the use of a fixed "y0" value is useful if a number of sections with individual parameter values need to be visualised. The zero line will then remain uniform throughout.
-
"Labelling" group box
Automatic section labelling can also be used instead of the legend described above. When activated the program inserts a table below the section, containing the selected values at the points defined. If the section is visualised together with the labelling table the size and position of the section graphics must be adapted by hand in the menu item "Page size + margins/Manual resize (editor)".
The labelling font size can be altered to suit requirements. If the "Labelling coloured" check box is activated the measured data is visualised in the defined value colours.
-
"Operations" group box
The current section can be saved to a file using "Save section". The section will be drawn on the screen after clicking the "Display" button. Beside the legend containing the measured data, which can be activated in the upper group box of the dialog box, a location sketch is automatically displayed on the screen showing the system outline and the defined section. This section course legend is activated by default, but can be deactivated in the "Graphics preferences/Section course legend" menu item.