
If the "Smooth colour gradient" check box is activated the symbols are continuously and smoothly coloured according to the parameter value and the colours assigned to Value 1 and Value 2.
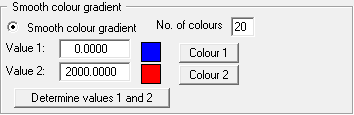
Determine the minimum and maximum measured data values using the "Determine values 1 and 2" button; they are automatically entered into the input boxes. If the values are crooked user-defined values can be used. The limit colours are defined using the "Colour 1" and "Colour 2" buttons. Define the number of colours for the colour gradient and thus the subdivisions of the colour scale. Using the example shown, for example, a colour scale is achieved with a colour change after every 100 mg/kg of the measured data.
Once the preferences for the gradual colour gradient are defined, the visualisation is shown after closing the dialog box via "Show symbols". A colour bar at the right edge of the sheet allows correlation between the colour and the corresponding parameter value. If this colour bar is drawn in the right page margin, specify a larger value for the right plotting margin (e.g. 25 mm) in the "Page size + margins/Page size and margins" menu item.