
After selecting this menu item a dialog box appears, in which you can edit preferences for graphical visualisation.
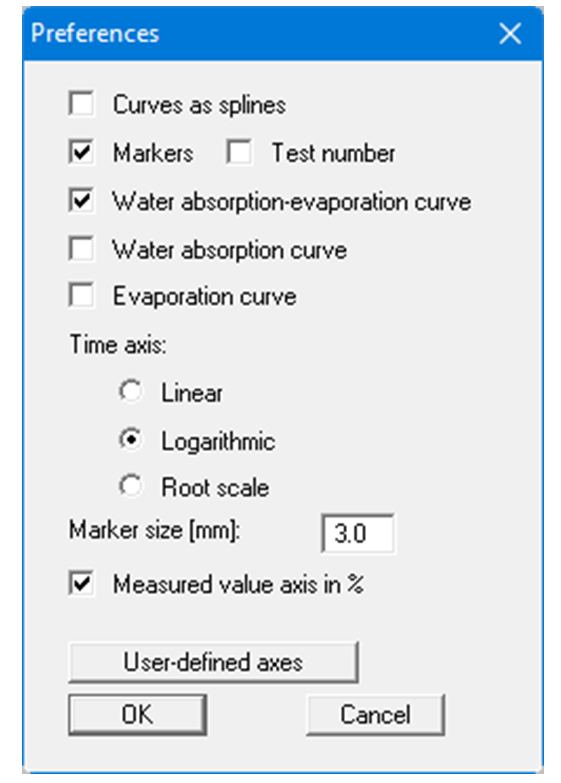
The "Curves as splines" check box allows rounding of the curves in the graphical visualisation. Activating the corresponding check boxes you decide whether markers or test numbers are to be entered at the water content diagram points. If neither of the two check boxes is selected, the values will not be marked. The marker size is user-defined.
If you activate the "Water absorption-evaporation curve" check box (default setting), the difference between the water absorption and the evaporation is visualised in the diagram. In addition, the water absorption curve and/or the evaporation curve can be visualised by activating the corresponding check box.
The time axis can be represented as "Linear", "Logarithmic" or to "Root scale". By clicking the "Measured value axis in %" check box the water content can be represented as % or in cm³.
The program automatically selects a sensible axes scale for the graphical visualisation of the water content diagram. If the "User-defined axes" button is clicked a dialog box opens allowing the check box "Use the following axes values" to be activated. The required value for the maximum time and the maximum water content can then be entered.