
In section, a hydrograph is displayed with a separate pen for each selected date. The colour, dashing (type/length) and pen thickness can be edited for each of the 40 possible date values in the following dialog box.
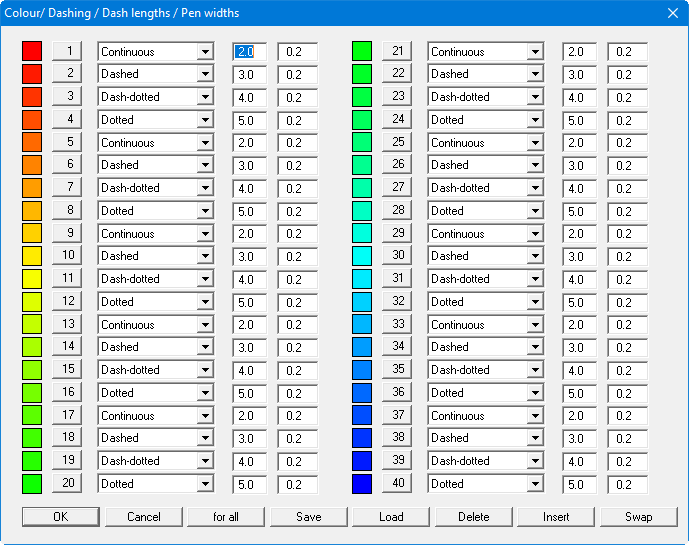
The default setting shows a course from red to blue for 40 date values. If considerably less dates than this are visualised in a section it may make sense to define different colours. Different colours can be defined using the numbered buttons. One colour can be assigned to all values using the "For all" button.
You can change the sequence of the defined pens using the "Delete", "Insert" and "Swap" buttons. You can save your own pen collection to a file using the "Save" button and subsequently load it again at any time. If you save the file at the program level using the name "GGU-TIME-GRAPH.gng_stf", it is automatically loaded every time the program starts.