
After selecting this menu item, a dialog box opens allowing preferences for the graphical visualisation to be defined:
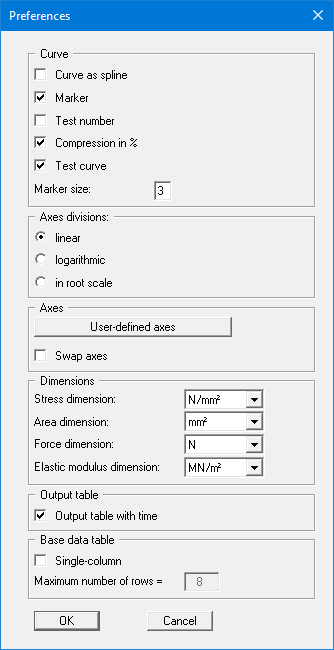
The use of markers or test numbers for the data points is specified by activating the appropriate check box. The marker size or font size of the test numbers is user-defined. If neither of these check boxes are selected the measured data will not be marked.
Activate the "Test curve" check box to get a curve. The curve can be displayed as a spline, the compression in either [mm] or in [%].
Select between linear, logarithmic or root scale axes divisions for visualisation of the uniaxial compressive stress.
The program automatically selects a sensible axes scale for the graphical visualisation of the pressure-compression diagram. If the "User-defined axes" button is clicked a dialog box opens allowing the "Use the following axes values" check box to be activated. The required value for the maximum compressive stress and the maximum compression can then be entered. You can display the x- and y-axis the other way round if you activate the "Swap axes" check box.
In the next area you can select the dimensions for stress, area, force and E-modulus. Below that you can activate the display of the output table with time and influence the table of basic data that is displayed on the diagram page.