
If you have entered different permeabilities as a function of time for the respective soil layers in the "Time BC/Soil properties" menu item, the function k = f(t) is displayed if the "Show legend" check box is activated. In the dialog box to this menu item preferences for the legend visualisation can be edited.
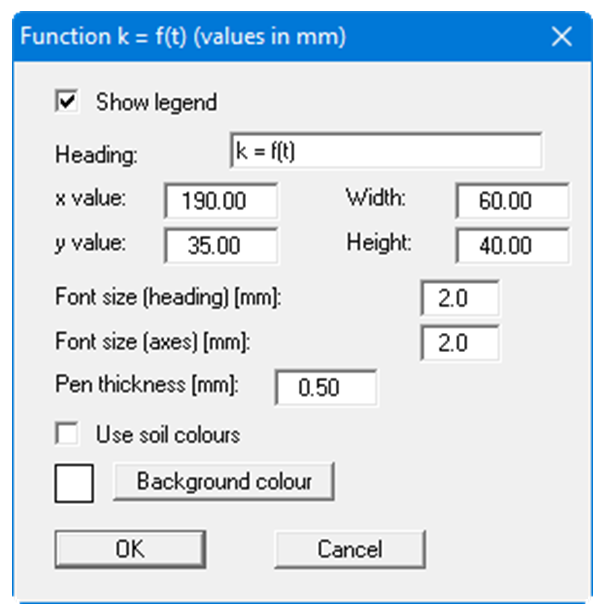
The position of the legend can be defined or edited by means of the variables "x" and "y", "Width" and "Height". If you edit the font sizes you should also always increase the width and height correspondingly, otherwise the actual function graphic will appear smaller within the defined legend frame.
If the "Use soil colours" check box is activated, the individual graphs are colour-differentiated. However, if the graph values are the same for all soils, the function graph is automatically drawn in black and a corresponding note added to the graphics. Additionally, you can define a background colour for the legend.