
On the basis of Test 5, time-settlement analysis with compression indices (see Section 5.3) shall now be demonstrated. In addition to the values from Test 5, we need the following input data:
-
Compression index CC
-
Pore ratio e0(top) = pore ratio e0 at top of layer
-
Stress σ'0(top) = effective stress σ'0 at the top of the layer before loading
-
Stress σ'0(bottom) = effective stress σ'0 at the bottom of the layer before loading
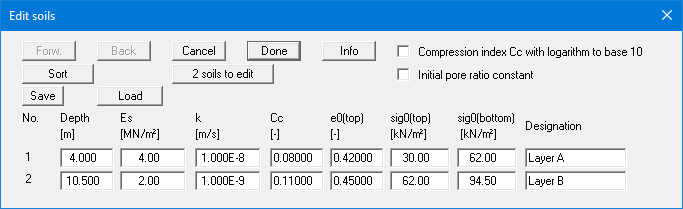
The compression indices CC and the pore ratio e0(top) are known from load-settlement tests.
-
Layer A
CC = 0.08
e0(top) = 0.42 -
Layer B
CC = 0.11
e0(top) = 0.45
The stresses σ'0(top) and σ'0(bottom) prior to loading can be determined from the unit weights of the individual layers and their thicknesses. We have the following unit weights:
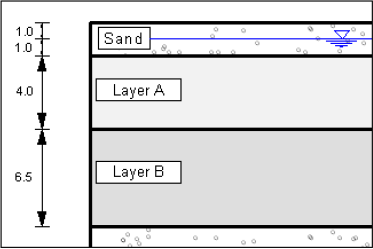
-
Sand
γ/γ' = 20/10 kN /m³ -
Layer A
γ' = 8 kN /m³ -
Layer B
γ' = 5 kN /m³
The groundwater level is at 1.0 m below the embankment formation level. This gives us the following stress values:
-
Layer A
σ'0(top) = 1.0 · 20.0 + 1.0 · 10.0 = 30 kN/m²
σ'0(bottom) = 30.0 + 4.0 · 8.0 = 62 kN/m² -
Layer B
σ'0(top) = 62 kN/m²
σ'0(bottom) = 62.0 + 6.5 · 5.0 = 94.5 kN/m²
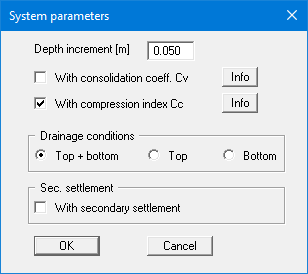
Now enter the values from Test 5 or open the corresponding data record. Then select the menu item "Edit/System parameters". Activate the button "With compression index Cc" and confirm with "OK".
Select the menu item "Edit/Soils" and enter the following values:
Go to the "System/Analyse" menu item. The various result graphics are then displayed on the screen, including the pore water pressure diagram.
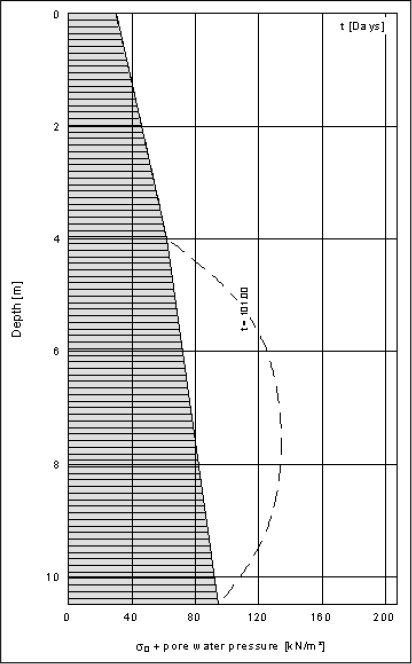
Double-clicking in the diagram opens the editor box; here, you can select a visualisation using 101 days by pressing the "Select times" button. The effective stresses σ'0 are also displayed in the pore water pressure diagram.
An evaluation of the analysis shows that the consolidation time until 80% settlement is achieved is around 210 days. However, as this analysis also includes the tipping time of 100 days, the lying time after completion of tipping is reduced to 110 days.