
You can define and edit the position of the legend using the values "x" and "y". The size of the legend is controlled by the height-width ratio. The fastest way to modify the position of the legend is to press the [F11] function key and then to pull the legend to the new position while holding the left mouse button.
If you work with the p-y method, a legend of the p-y curves can be displayed. Using this menu item, you can alter the type of presentation or turn off the legend completely.
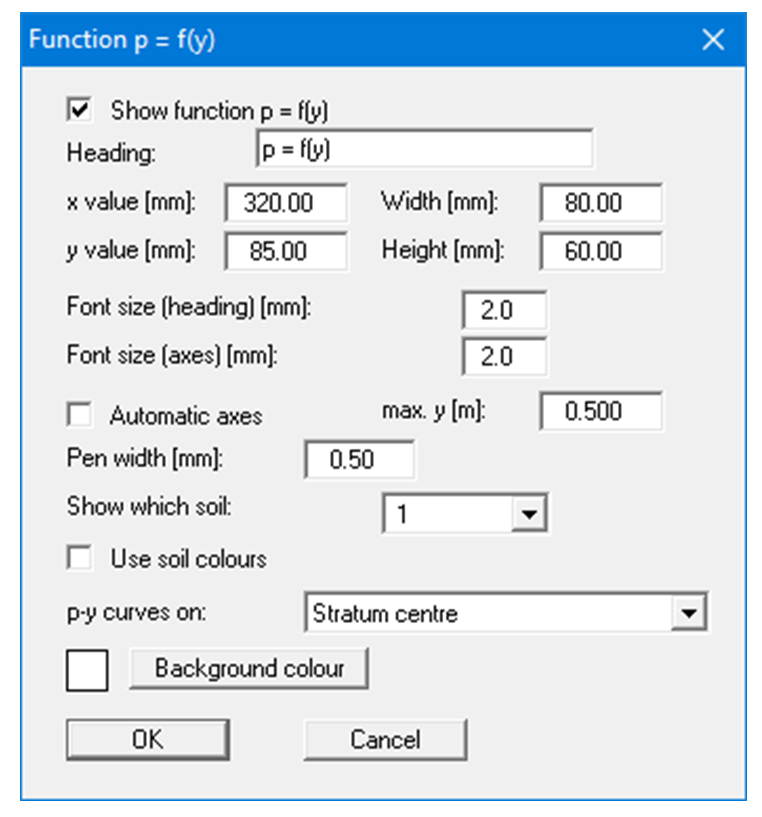
You can define and edit the position of the legend using the values "x" and "y". The size of the legend is controlled by the height and width you have entered. The fastest way to modify the position of the legend is to press the [F11] function key and then to pull the legend to the new position while holding the left mouse button.
You can adapt the display of the function p = f(y) to meet your requirements based on the selected soil, alignment of the p-y curves or line colours.