
If the hydrographs are visualised in a section a descriptive legend containing an allocation of the graphs to the selected dates can be displayed. The position and appearance of the legend can be modified if the "Show legend" check box in this menu item's dialog box is activated.
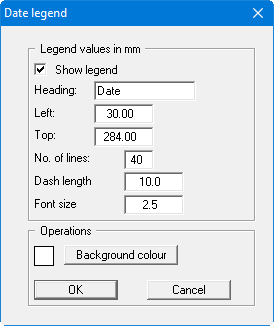
A text can be specified as legend header. You can define and edit the position of the legend using the values "x" and "y". You control the size of the legend using "No. of lines", "Dash length" and "Font size"; where necessary, several columns are used. The fastest way to modify the position of the legend is to press the [F11] function key and then to pull the legend to the new position with the left mouse button pressed. The legend can be provided with a coloured background fill; the colour can be edited via the "Background colour" button.