
You can visualise lines of equal water level (potentials) using this menu item. You will see the following dialog box, in which you can specify the type of presentation.
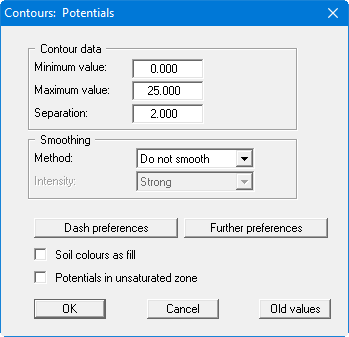
The program shows you the existing smallest and largest values and the spacing of the contour lines. If you want the visualisation to begin at a different value, the initial value can be entered here. You can also vary the spacing, for example, in order to reduce the number of contour lines drawn.
When you select this menu item the settings displayed here are always those automatically selected by the program. Using the "Old values" button, the preferences used for the previous contour line diagram are adopted. This information is saved with the record.
You can also select from three smoothing out procedures:
-
"Do not smooth"
As a linear method is implemented within the triangle elements, this will provide modelling results without smoothing performed by the program. -
"Method 1" and "Method 2"
these smoothing out procedures employ two different Bezier splines. Smoothing out intensities can be given for both in order to acquire smooth contour lines. Method 2 creates very "round" contours, with the danger that the true results may be falsified.
You can specify the type of visualisation for the contour lines by means of the "Further preferences" button. By activating the appropriate check box the soil colour can be used as fill.
As the program calculates with unsaturated permeabilities, potentials in the unsaturated zone are the result, which is physically absolutely correct. From experience, this confuses some clients. To save long discussions, switch off the potential lines in the unsaturated zone with the corresponding switch.