
If you have selected section functions when evaluating the analysis results, e.g. values in the node section, you can use this menu item to display and edit a legend containing the section course
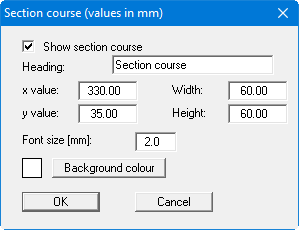
The position of the legend can be defined and edited using the values "x" and "y", "Width" and "Height". The legend heading and font size can be modified as well as a background colour.
Even when the "Show section course" check box is activated, visualisation only occurs if you perform a section evaluation.