
You can generate oriented circle charts with this menu item. The sizes of the circles are represented as a function of the values of the parameters. Mark the parameter to be represented as a circle chart in the first dialog box. The following dialog box then appears:
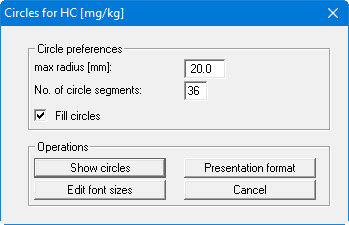
You must specify the number of segments in the circle, in addition to the maximum circle radius. If you enter a "3" for the number of segments, triangles will be displayed instead of circles.
Using the "Presentation format" button it is possible to alter the settings for circle presentation in analogy to the description given in the menu item "Graphics/Contours (normal)" (see Section "Presentation format" button). A heading can be entered in the preferences dialog box; this is used as the heading for the general legend .
After closing the dialog box via the "Show circles" button the circle charts are displayed on the screen. The colour fill of the circles is defined via the value colour of the selected data; changes can be made via the "Edit/Value colours" menu item.