
You can generate oriented pie charts using this menu item. In the first dialog box you mark the parameters to be represented as percentages in the pie charts, analogous to the "Chart evaluation/Bars" menu item. A dialog box then appears, in which you must specify the radius of the pie charts.
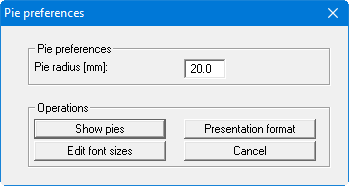
Using the "Presentation format" button it is possible to alter the settings for pie presentation in analogy to the description given in the menu item "Graphics/Contours (normal)" (see Section, "Presentation format" button). A heading can be entered in the preferences dialog box; this is used as the heading for the general legend (see Section 6.4.9). It is additionally possible to select a colour fill or hatching for the pie chart. The fill and hatching line colours used are defined via the value colour of the selected data. Changes can be made by going to the menu item "Edit/Value colours".
After closing the dialog box via the "Show pies" button the pie charts are displayed on the screen.