
You can represent your data in oriented tables with this menu item. Mark the parameters to be represented in a table in the first dialog box. If you mark a number of parameters they will be represented in different rows in the table. The following dialog box then appears:
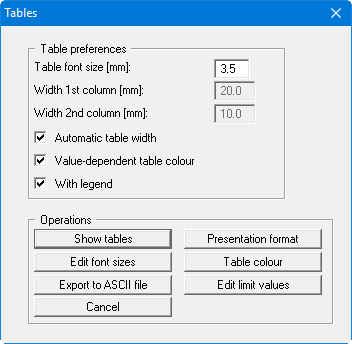
If the "Automatic table width" check box is activated the size of the table is controlled by the given "Table font size". The program optimises the column heights and widths automatically to suit the selected font size. The column widths can be user-defined if the check box is deactivated; however, this generally only leads to optimum results by trial and error.
If the "Value-dependent table colour" check box is activated, the table cells containing the measured data are coloured according to the settings specified via the "Edit limit values" button. The settings are described in detail in the menu item "Chart evaluation/Bars", "Value-dependent colour-fill" button.
Using the "Presentation format" button it is possible to alter the settings for table presentation in analogy to the description given in the menu item "Graphics/Contours (normal)" (see Section "Presentation format" button). A heading can be entered in the preferences dialog box; this is used as the heading for the general legend. Additionally, the "Table coloured" check box can be activated in the table presentation settings box. The column containing the measured data designation is then colour-filled using the colour defined via the "Table colour" button in the above dialog box.
It is possible to save the current data to a file using the "Export to ASCII file" button and process it further in third-party applications, e.g. in a spreadsheet. Specify the number of columns according to the number of data points. If the number given is smaller than the actual number of data points two or more tables are written below each other in the file. The number of decimal places to apply for the measured data can also be specified. For example, if the measured data is to be output in m AD, a "2" should be specified here.