The image coordinates can be modified by direct numerical input in a dialog box. The dialog box displays the existing preferences for the currently selected visualisation. In the dialog box example shown, which opens for hydrograph visualisation, an earliest and a latest date can be specified for the x-axis and a minimum and a maximum measured data value for the y-axis.
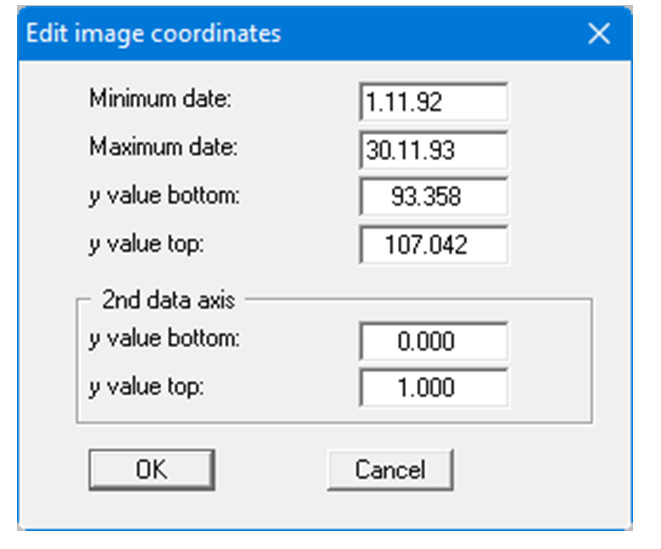
If you have activated visualisation of data points on a 2nd measured data axis, you can also define the upper and lower y values for this 2nd axis.
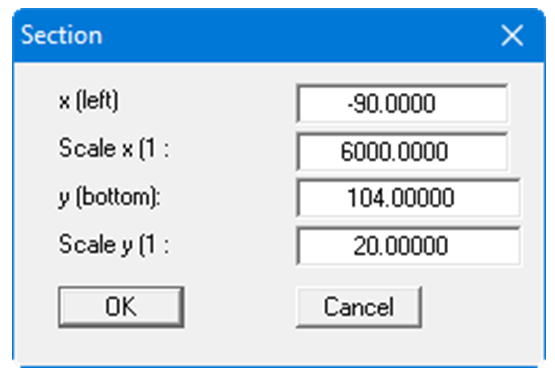
The lower and left image boundary and the scale in x- and y-direction are defined for contour or section visualisation. In the same way it is possible to always use the same scale and the same coordinates for different sections, to facilitate direct comparisons, for example.