
Using this menu item you can define the format of the hydrographs visualisation for the user-defined data points in a dialog box.
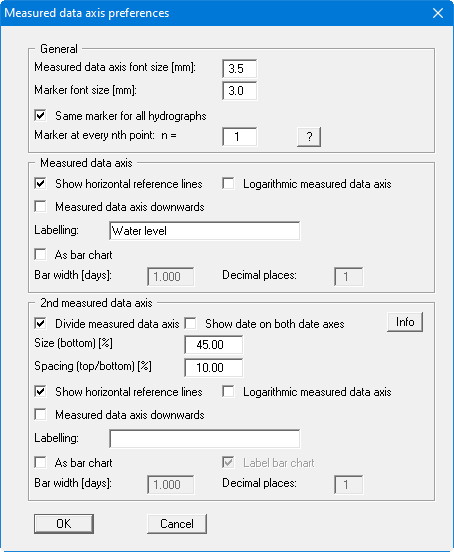
In the "Measured data axis" group box you can define horizontal reference lines, measured data axis font size, markers preferences, etc. It is also possible to define a logarithmic measured data axis or to visualise the hydrographs as a bar chart, e.g. to visualise precipitation data. The measured data axis can also be labelled in this menu item's dialog box.
The second measured data axis will only be used if the check box "Display on 2nd measured data axis" in the editor of at least one of your data points is activated.