
After selecting the required parameter, circle charts can be generated. The selected values (potentials, velocities or gradients) are displayed as circles of varying (value-dependent) circles.
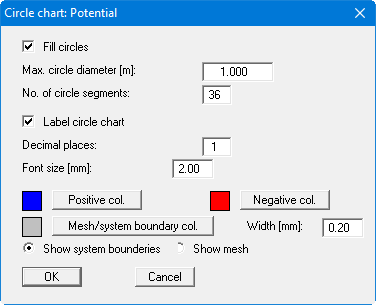
If you activate the "Fill circles" check box the values are represented with a colour fill defined using the "Positive colour" or "Negative colour" buttons, corresponding to their sign. The "Max. circle diameter" defines the circles diameter for the largest value. The "No. of circle segments" specifies the resolution of the circle. For example, triangles are represented for a value of 3. Each circle can be annotated with the corresponding value. The system boundaries or the FEM mesh can be drawn in addition to the circles. The colour and width of the pens can be specified for the graphical visualisation.