
All important analysis results can be displayed graphically in a table. The parameters for visualisation are selected in the dialog box and their format can be modified.
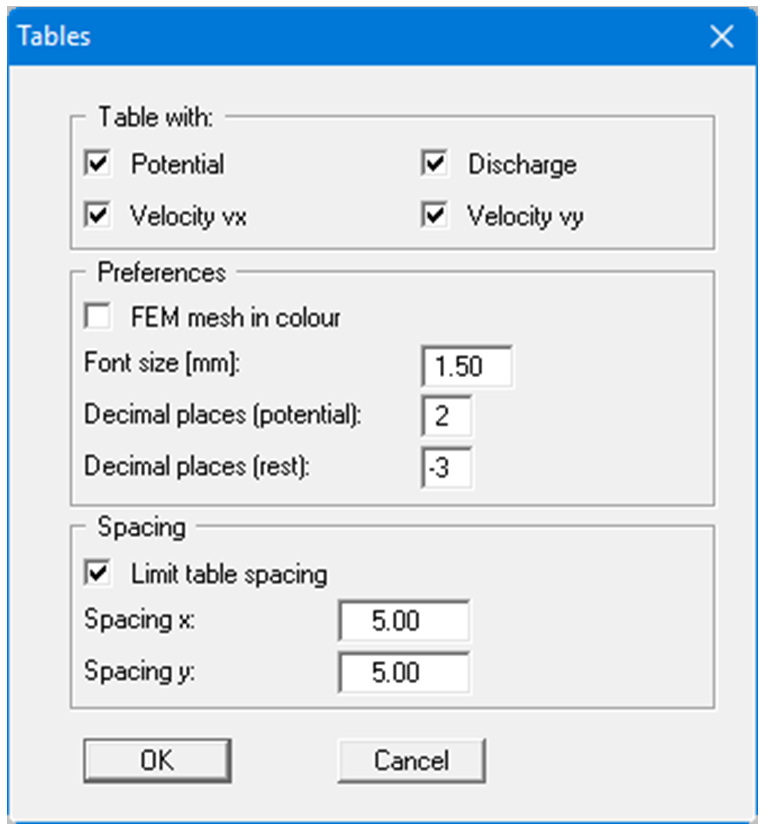
The result tables are displayed in the graphics directly after using "OK" to exit the dialog box. A spacing can be defined to ensure that the tables do not overlap. The tables are then only displayed for the points of the defined grid.