
Once the bar visualisation is selected for evaluation a corresponding legend appears on the output sheet. If the "Show legend" check box is activated the presentation format can be edited in the dialog box for this menu item. The dialog box can also be accessed by double-clicking in the legend box.
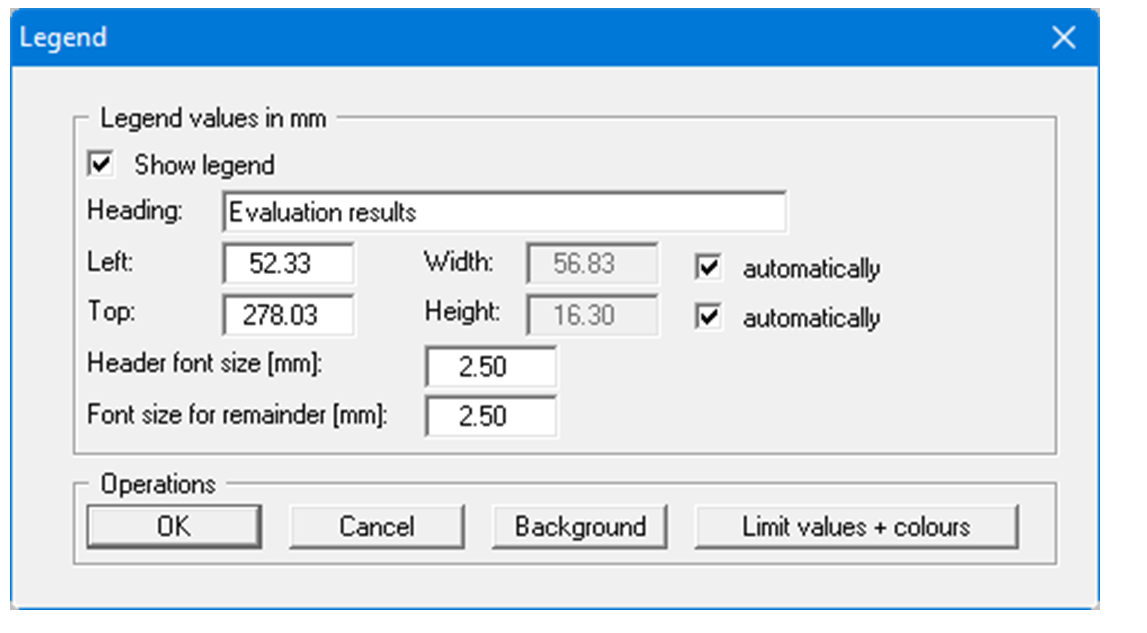
Input here defines the upper left corner of the legend box. The "automatically" check boxes should always be activated for specifying the width and height, because the size of the legend is then adapted to the number of measured data points and the length of the measured data designations. The font sizes for the heading and the measured data names can also be specified, as well as selecting a background colour for the legend.
The "Limit values + colours" button is only relevant for evaluation using value-dependent, colour-filled bars. The button can be used to alter the settings for value-dependent colour-fill. The same dialog box opens as for the menu item "Chart evaluation/Bars", "Value-dependent colour-fill" button.
For a normal, coloured bar chart the measured data represented as bars are shown in the legend together with the corresponding value colours. The colours can be changed by going to the menu item "Edit/Value colours".