
If a sectional visualisation is used a legend containing the displayed measured data and the corresponding value colours is shown on the output sheet. The colours can be changed by going to the menu item "Edit/Value colours". If the "Show legend" check box is activated the legend presentation format can be altered in the dialog box for this menu item. The dialog box can also be accessed by double-clicking in the legend box.
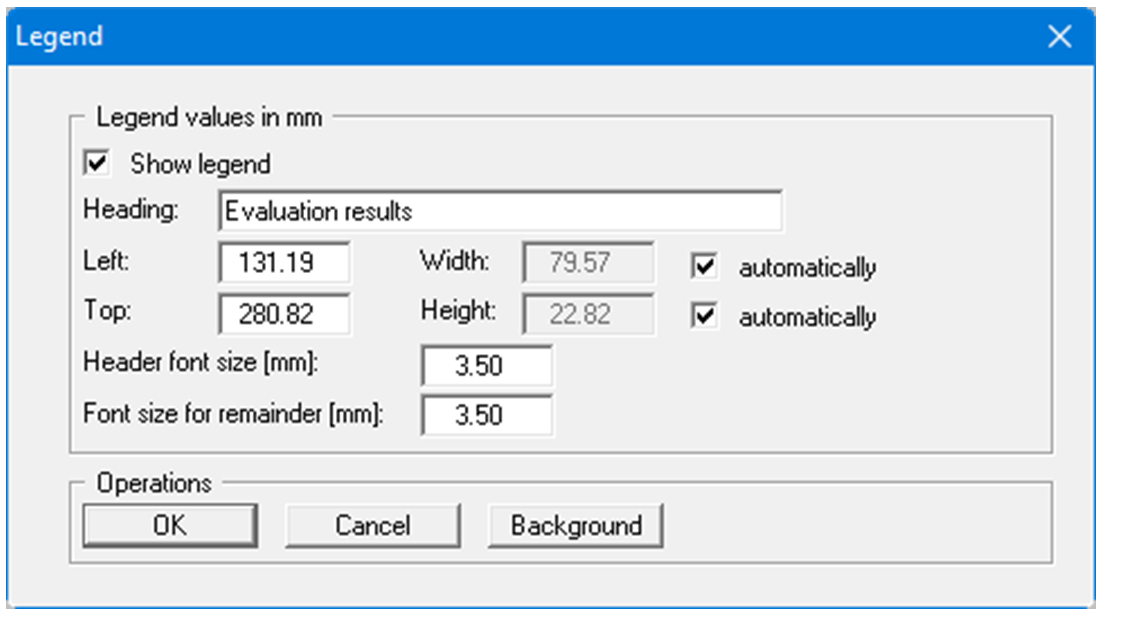
Input here defines the upper left corner of the legend box. The "automatically" check boxes should always be activated for specifying the width and height, because the size of the legend is then adapted to the number of measured data points and the length of the measured data designations. The font sizes for the heading and the measured data names can also be specified, as well as selecting a background colour for the legend.