
If you have selected a value-dependent colour visualisation for the table graphics a corresponding evaluation legend is displayed on the output sheet. If the "Show legend" check box is activated the legend presentation format can be altered in the dialog box for this menu item. The dialog box can also be accessed by double-clicking in the legend box.
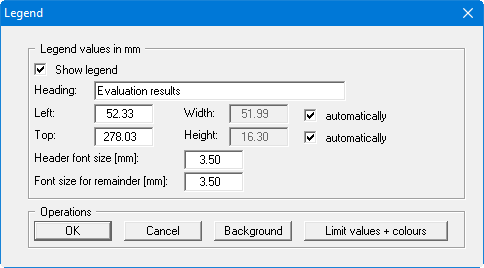
Input here defines the upper left corner of the legend box. The "automatically" check boxes should always be activated for specifying the width and height, because the size of the legend is then adapted to the number of measured data points and the length of the measured data designations. The font sizes for the heading and the measured data names can also be specified, as well as selecting a background colour for the legend.
It is possible to alter the settings for value-dependent colour-fill by pressing the "Limit values + colours" button. The same dialog box opens as for the menu item "Chart evaluation/Tables", "Edit limit values" button.