
The data you have entered can be represented as contour lines using this menu item. After selecting the menu item you then select the data to be represented as contour lines.
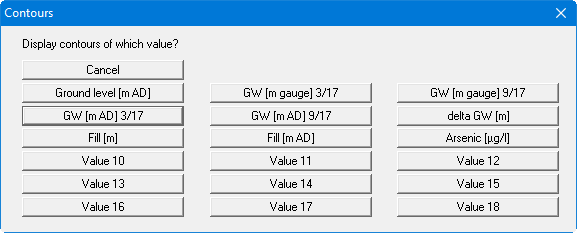
After selecting a parameter you will see the following dialog box:
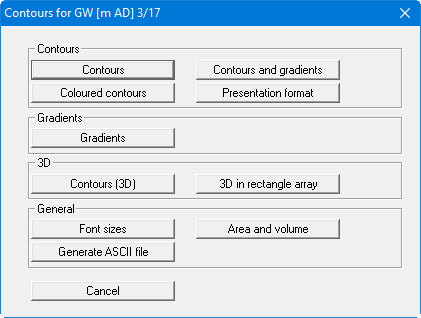
In addition to the buttons described in more detail in the following secions, the following operations can be carried out here:
-
"Contours and gradients"
Allows combined presentation of contours and gradients. The settings for contour line representation are described in Section . The description of gradient representation can be found in Section “"Gradients" button”.
-
"Font sizes"
You define the font sizes for axes labelling, etc. -
"Area and volume"
The program computes the area and volume resulting from the values measured within the defined triangle mesh. If data smaller than zero is present, negative volume will also be computed. If the appropriate values are entered (e.g. ground level, thickness of topsoil, location of the excavation level) excavation volumes can also be computed. -
"Generate ASCII file"
You can generate an ASCII file with the current data, which can subsequently be processed further, for example in a spreadsheet.