
If you click the "Value-dependent colour-fill" button in the option box for the bar graphics the measured to be displayed can be selected. The following dialog box opens:
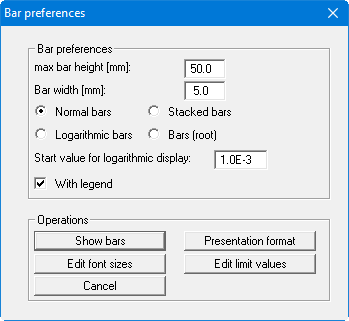
The input boxes and buttons in this dialog box are identical to those in the box described in Section "Normal bars". However, an additional button, "Edit limit values" is shown for the value-dependent bar chart, opening the following dialog box
The "Colours + no. of values" button allows you to define the number of limit values (maximum 5) and the corresponding text and colour. The following dialog box opens, for example, containing 4 defined limit values.
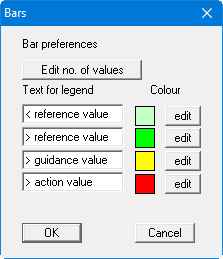
An additional limit value can be defined or the number reduced using the "Edit no. of values" button. The texts can be adapted to your requirements and the colours assigned to the respective values via the "edit" button. The changes are accepted via "OK" and you return to the above dialog box.
-
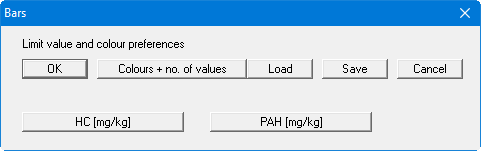
The settings can be saved to a file with the ".blk" extension via the "Save" button . If the file is saved in the program folder (default) the preferences will be automatically loaded the next time the program is started. Different settings files can be opened for the current session via the "Load" button.
In the lower region of the above dialog box the measured data selected for display are shown as buttons, 2 values in the example: "HC [mg/kg]" and "PAH [mg/kg]".
-
The limit value for each quantity can be specified by selecting it (e.g. HC).
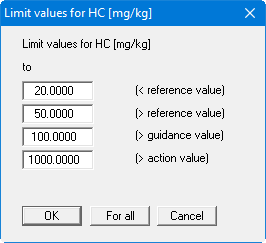
Four limit values are shown here, corresponding to the settings specified by pressing "Colours + no. of values". The "For all" button adopts the limit values given here for all other values, which will only rarely be useful.
Once you have finished defining preferences, click "Show bars"; the bar charts will then be generated. The bars are coloured according to value of the parameter and the corresponding limit values. If the measured value exceeds the maximum value defined in the classification, the bar remains uncoloured. It therefore makes sense for many applications to define a further limit value above the actual maximum.