
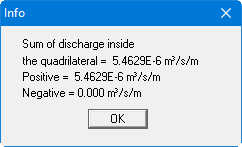
Go to the "Evaluation/Discharge" menu item. Accept the display preferences and exit the dialog box using "OK". The system is now displayed with discharges. Using the rectangle, trace around the nodes on the water side that are labelled with a discharge. The sum of the discharges is displayed in a message box.
Trace around the nodes on the air side that are labelled with a discharge.
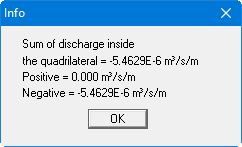
The same value is shown in the message box, but with a negative sign, because here the water exits the system.
The water percolating through the embankment is thus:
Q = 5. 46 · 10-6 m³/s/m embankment = 0.47 m³/day/m embankment