
If you activate the "Discrete colour gradient" check box in the lower section of the above dialog box, the symbols will be colour-filled to allow a classification corresponding to that used for the bar charts with value-dependent colour-fill.
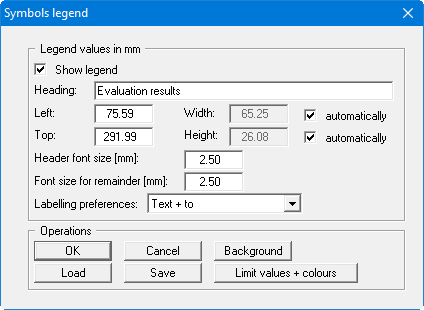
After clicking the "Colour + legend preferences" the following dialog box opens for specifying legend preferences; these were previously explained in the menu item "Graphics preferences/Symbols legend".
The "Limit values + colours" button is crucial to subsequent colour visualisation. It opens the following dialog box:
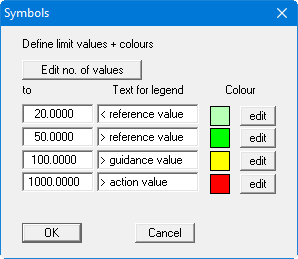
An additional limit value can be defined or the number reduced using the "Edit no. of values" button. The texts can be adapted to your requirements and the colours assigned to the respective values via the "edit" button. Because only one value can be selected for the symbol chart, the limit values are entered directly, in contrast to the value-dependent bar chart. The changes are accepted via "OK" and you return to the above dialog box. The preferences can be saved in a file with the ".leg" extension. If the file is saved in the program folder (default) the preferences will be automatically loaded the next time the program is started.
Once the settings are completed and the legend box is closed by pressing "OK" the evaluation and symbol visualisation is started by pressing the "Show symbols" button in the start box.