
The charts (bar, pie, etc.) can be represented with a colour fill. Here, the individual parameters can be assigned certain colours.
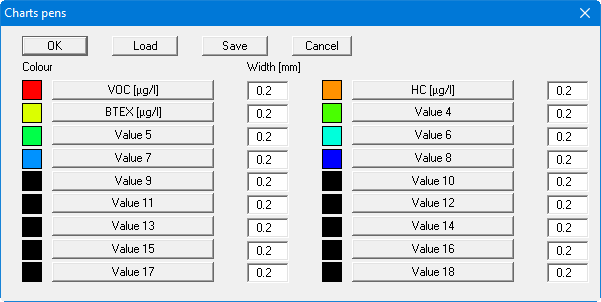
The pen colour can be edited by clicking the corresponding button and the pen width in the adjacent box. Your preferences can be saved in a file with the ".frb" extension. If you save the file in the program folder (default), your preferences will be automatically loaded the next time you start the program.