
After selecting the required parameter, a circle chart can be generated containing the appropriate state variable as differently sized (value-dependent) circles. Using result visualisation in circle format it is possible to swap between state variables and reinforcement in analogy to the contour line visualisation dialog box.
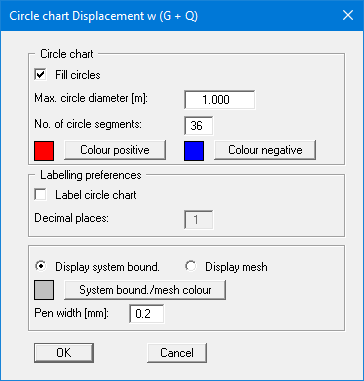
If you activate the "Fill circles" check box the state variables are represented with a colour fill defined using the "Positive colour" or "Negative colour" buttons, corresponding to their sign. The "Max. circle diameter" defines the circles diameter for the largest state variable. The "Number of circle segments" specifies the resolution of the circle. For example, triangles are represented for a value of 3. Each circle can be annotated with the value of the state variable. The system boundaries or the FEM mesh can be drawn in addition to the circles. The colour and width of the pens can be specified for the graphical visualisation.