GGU-FIELDCAPACITY: Evaluation sheet
The A4 portrait evaluation sheet is the result of the program. It is rebuilt immediately with every input and is exactly what you get from the PDF export.
Layout
- Header: company with logo, report and annex number, the two headings, operator, date, project number, project name and client. Where this data comes from is described under Project and company.
- Table: one column per sample, at most six. The column is headed by the sample name.
By default the table contains these rows:
- Borehole, sampling depth [m]
- Clay content T, silt content U, sand content S [%], each related to the fine soil
- Soil type KA5, Tab. 30
- Gravel content in mass %
- Dry density pd [g/cm³] and its classification per KA5, Tab. 68
- TOC content [%], organic matter (calculated) [%] and the humus content classification per KA5, Tab. 15
- Wilting point per KA5, Tab. 70 and soil wilting point PWP [vol. %]
- Group Soil field capacity: field capacity per KA5, Tab. 70, organic matter surcharge per KA5, Tab. 72, field capacity of fine soil plus surcharge, gravel content and soil field capacity FK [vol. %]
- Group Soil air capacity (with gravel): the same sequence for the air capacity LK [vol. %]
- Group Available soil field capacity: field capacity, wilting point and available field capacity nFK [vol. %]
How the values are obtained is described in Calculation according to KA5. A dash "–" means that an input value is missing for this sample or that no value could be determined.
Evaluation sheet rows
Menu Edit / Evaluation sheet rows (Ctrl+Shift+R). Here you decide which rows appear on the sheet and in which order.
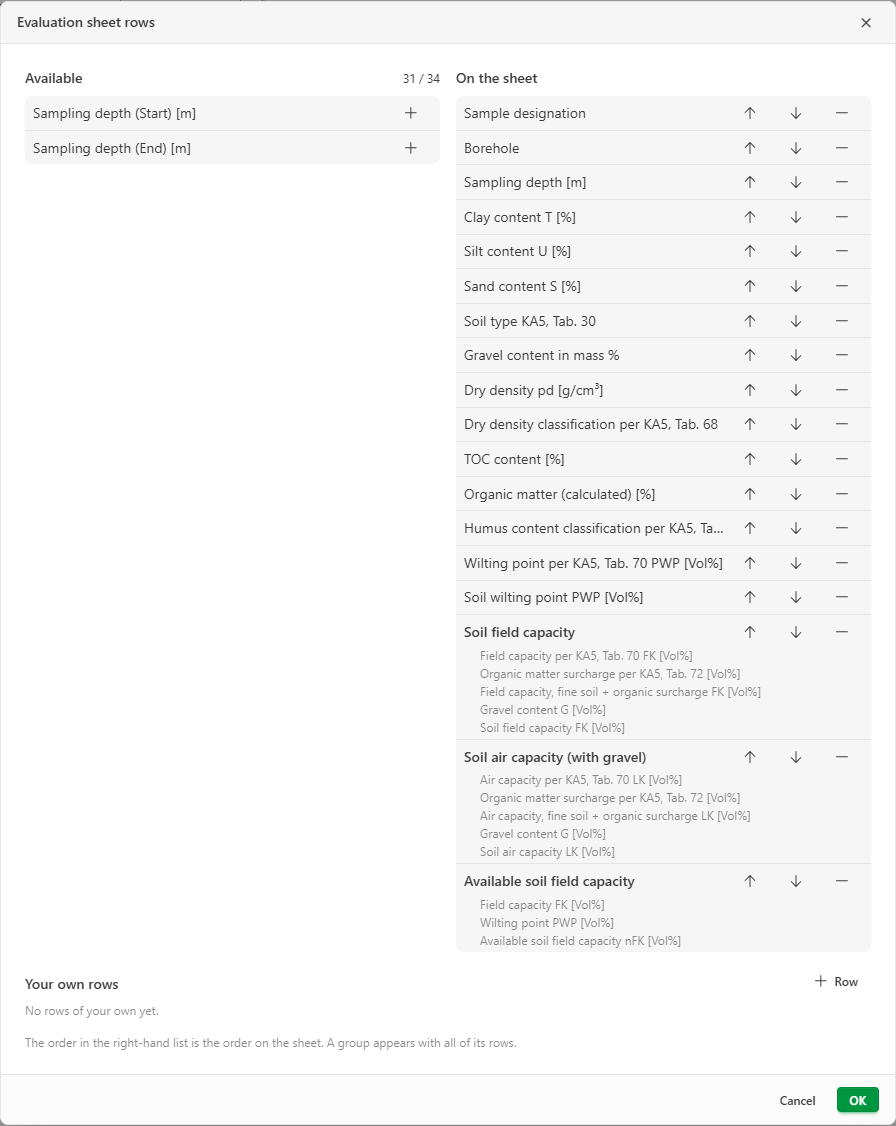
- Available (left) holds the rows that are currently not on the sheet. + adds a row to the sheet. By default this list contains "Sampling depth (Start)" and "Sampling depth (End)", in case you prefer to show the depths separately, and "Sample type", which shows "Sample" or "Mixed sample" for samples from GGU-CONNECT.
- On the sheet (right) shows the rows in the order in which they are printed. The arrows move a row, − removes it from the sheet.
- The groups field capacity, air capacity and available field capacity are always moved or removed with all their rows, so that the calculation stays complete on the sheet.
A counter next to the heading Available shows how many rows are used and how many fit on one sheet. Once the limit is reached, no further rows can be added.
The selection is saved with the project. Changes only apply after OK.
Your own rows
In the lower section Your own rows, the Row button (plus symbol) adds extra rows, for example for the sampling location or the sample mass. Give the row a name; it is placed on the sheet straight away. You then enter the values per sample under Edit / Samples in the section Your own entries (see Entering samples).
If you delete one of your own rows that already holds values, the program asks for confirmation. Deleting the row also removes its values from all samples.