
After selecting the required parameter, circle chart can be generated. The selected values are displayed as circles of varying (value-dependent) circles.
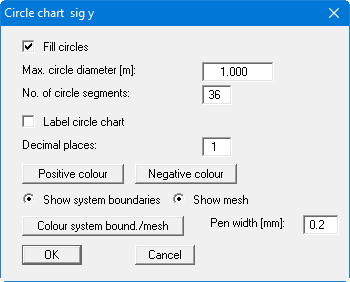
If you activate the check box the circles with positive vales will be filled with the "Positive colour" and those with negative values with the "Negative colour". With "Max. circle diameter" you set the circle diameter for the maximum state variable. With "No. of circle segments" you set a value for the circle resolution. For a value e.g. of 3, triangles will be drawn. You can label each circle with state variable value. With the "Positive colour" and "Negative colour" buttons, you can edit the colour fill for the circles. In addition to the circles, the system boundaries or the FEM mesh can be shown. With "Colour system bound./mesh" and pen width you can set preferences for graphical presentation.