
Numerous options are available for evaluation and graphical representation of the analyses. If you select a contour, circle chart or section visualisation, the respective dialog box opens, in which you first select the state variable to be visualised.
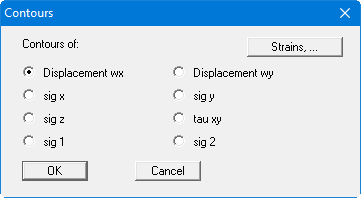
If you would like to have strains displayed, click on the "Strains,.." button and you will see:
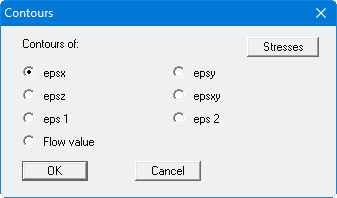
If you select the "Stresses" button, you will once again see the dialog box for selection of stresses and displacements (see above).